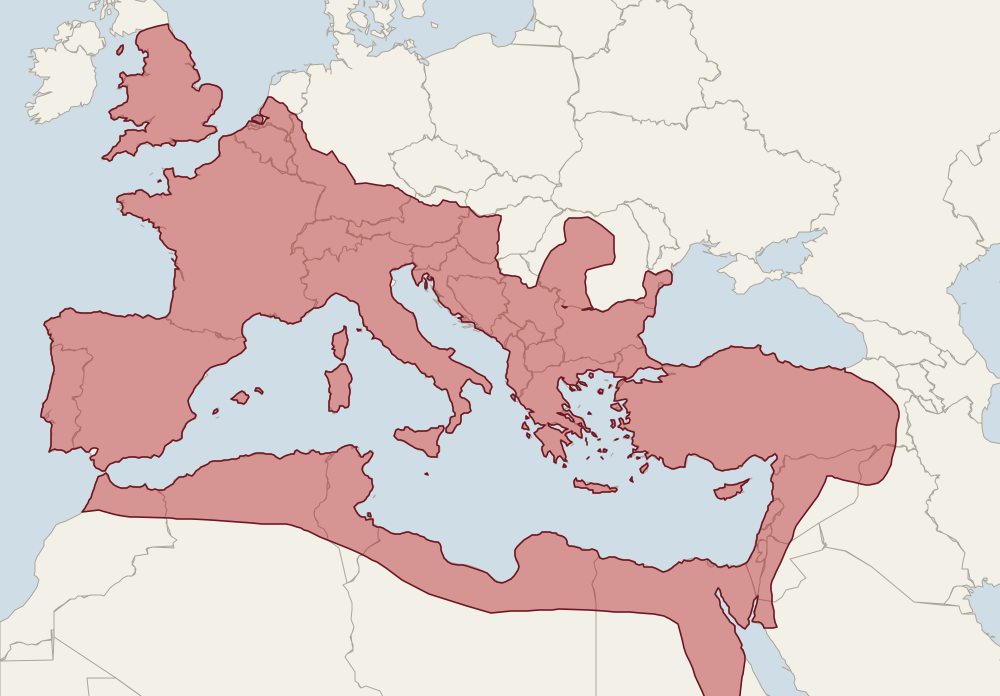
How big was the Roman Empire?
At its height, in AD 117, the Roman Empire covered about 4.88 million km² (4,880,924 km²). That is the figure measured from the Ancient World Mapping Center outline of the empire for that year, counting land only. You will often see around 5 million km² quoted instead. Published estimates differ because historians draw the frontier, the client kingdoms and the desert edges in different places, so treat all of these as good approximations rather than exact measurements.
The empire took centuries to reach that size. In 44 BC it covered about 1,972,439 km², and by AD 14 about 3,665,334 km². After the peak it shrank slightly to about 4,812,484 km² by AD 211.
These numbers are measured by the same script each time, from the outlines drawn on the map, so they change if the outlines change. The table below gives all 13 dates.
| Date | Area (km²) | What happened |
|---|---|---|
| 753 BC | 7.1 | The traditional founding of Rome |
| 264 BC | 131,515 | Start of the First Punic War; Rome controls peninsular Italy south of the Apennines |
| 133 BC | 805,540 | Pergamon is bequeathed to Rome; Numantia falls in Spain |
| 44 BC | 1,972,439 | Julius Caesar is assassinated; Gaul has been conquered |
| AD 14 | 3,665,334 | Augustus dies; Tiberius succeeds |
| AD 117 | 4,880,924 | The empire at its greatest extent, after Trajan's eastern conquests; Trajan dies and Hadrian succeeds |
| AD 211 | 4,812,484 | Septimius Severus dies; his sons Caracalla and Geta succeed |
| AD 395 | 4,717,842 | Theodosius I dies; the empire is divided permanently between his sons |
| AD 476 | 1,941,191 | Odoacer deposes Romulus Augustulus; the Western empire ends, the East continues |
| AD 565 | 2,910,368 | Justinian I dies after reconquering Italy, North Africa, coastal Dalmatia and south-east Spain |
| AD 1000 | 854,602 | Basil II rules a resurgent Byzantine Empire |
| AD 1180 | 591,029 | Manuel I Komnenos dies; the empire has lost the Anatolian interior but holds the Balkans |
| AD 1453 | 22,624 | Constantinople falls to the Ottomans |
Areas are land inside the outline, measured in an equal-area projection. Areas are land inside the extent, measured in the equal-area projection EPSG:6933. Published estimates of the empire's size vary with how the frontiers are drawn and with whether client states and seas are counted.
How the Roman Empire grew
The Roman Empire expansion map starts very small. In 753 BC, the date tradition gives for the founding of Rome, there is only a city, shown as a symbolic circle of 7.1 km². Over the next few centuries Rome beat its neighbours one by one. By 264 BC, at the start of the First Punic War against Carthage, it controlled the Italian peninsula south of the Apennines, about 131,515 km².
The wars with Carthage, Macedon and others brought the first provinces overseas. At 133 BC, when the kingdom of Pergamon was left to Rome in a will, the Republic covered about 805,540 km² and held land in Spain, Africa, Greece and Asia. This was still a republic, run by the Senate and by magistrates elected each year.
The next jump came with Julius Caesar. His conquest of Gaul helped to push the total to about 1,972,439 km² by 44 BC, the year he was murdered. The civil wars that followed ended the Republic. Augustus, the first emperor, won them, and by his death in AD 14 the empire covered about 3,665,334 km², with Egypt, Gaul, Spain and the Danube lands all Roman.
The last great gains came under Trajan. In AD 117 the Roman Empire at its height reached about 4,880,924 km², 33.2% more than at AD 14. Britain was inside the outline, and so were the lands that Trajan took in the east, in what is now Iraq. His successor Hadrian gave up some of the eastern gains, and the empire was a little smaller again by AD 211. The slider lets you watch each of these steps in turn, and every date has its own page, such as the Roman Empire in AD 117.
How to use the Roman Empire map
The slider snaps to 13 key dates from 753 BC to AD 1453. Use the arrow buttons or the arrow keys to step through them. Red is the empire. From AD 395 the Eastern half turns purple and the Western half orange, and at AD 565 the orange area shows the lands Justinian reconquered.
Switch on Provinces to see province outlines for the dates where we have them, Roman cities to see the places in the Pleiades gazetteer that were in use in that period, and Roman roads for the main road network. Switch on Modern country borders to compare with today's map. Tap or click anywhere to see the province (if it was Roman at that date) and the share of today's country that lay inside the empire.
If you are using the map in a lesson, a good way to start is to set the slider to 44 BC, then AD 14, then AD 117, and ask what changed each time. Then switch on Provinces: the Roman provinces map shows how the empire was divided up for government, each with a governor and a capital. Tap a province to see when it was added and lost, and which modern countries it covers today.
Why the borders on a Roman Empire map are approximate
No Roman map showed the empire as a line on a page, and historians still argue about where the edges were. There are three main reasons the outlines you see here should be read as good estimates rather than exact borders.
- Frontiers were zones. A river or a wall such as Hadrian's Wall marked where the army stood, not a line that nobody crossed. Trade, people and ideas moved across it all the time.
- Client kingdoms. Rome often ruled through friendly kings who kept their own thrones. Whether to colour them as Roman is a judgement call, and it is one reason published sizes of the empire differ.
- Many dates are rebuilt. Detailed outlines exist for only a few dates, such as AD 117 and AD 211. For 133 BC, 44 BC, AD 14, AD 395 and AD 565, the extent is rebuilt from the provinces Rome held, using the later outlines of the province map. Dates are the evidence there, and the shapes are a guide. 264 BC, AD 1000 and the later Byzantine dates follow modern regional boundaries, so they are coarser still.
Each year page says how its outline was made. The data comes from the Ancient World Mapping Center, published under the ODbL licence. See data sources and licences.
The Roman Empire and today's countries
At AD 117, 45 modern countries were at least partly inside the empire. The ones with the biggest share inside were Bosnia and Herzegovina, Kosovo, Liechtenstein, Luxembourg, San Marino, Vatican City, Andorra and North Macedonia. The list under the map shows the same for any date, and every country with enough Roman history has its own page, such as Roman Britain, Roman France and Roman Italy. See all countries.
The Eastern and Western Roman Empire
In AD 395 the empire was divided for good. On the map the Western half covered about 2,776,651 km² and the Eastern half about 1,941,191 km² of the 4,717,842 km² in total. The West ended in AD 476, leaving the East at about 1,941,191 km². By AD 565 Justinian had won back enough to bring the total to about 2,910,368 km², and by AD 1453 the empire was down to about 22,624 km². The Byzantine Empire map follows the Eastern empire date by date.
Why the Roman Empire "fell" twice
People often ask when the Roman Empire fell, and there are two good answers. The first is AD 476, when the Germanic general Odoacer removed the last western emperor, Romulus Augustulus. After that there was no emperor in the West. On the map, 26 modern countries that had been inside the empire at AD 395 drop out at that date, among them France, Spain and Italy, leaving the Eastern empire at about 1,941,191 km².
The second is AD 1453, when the Ottomans took Constantinople. The Eastern empire lasted another 977 years after the West fell, though historians now call it the Byzantine Empire. It peaked after Justinian's reconquests, at about 2,910,368 km² in AD 565. By AD 1000 it was down to about 854,602 km², and at the end only about 22,624 km² remained. Its people always called themselves Romans, and the Byzantine Empire map lets you follow them to the end.
Explore by date
Frequently asked questions
How big was the Roman Empire?
At its height, in AD 117, the Roman Empire covered about 4.88 million km² (4,880,924 km²) of land, measured from the Ancient World Mapping Center outline of that year. Figures you will often see quoted are around 5 million km². The difference comes from where the frontiers and client states are drawn, and from whether seas are counted.
When was the Roman Empire at its largest?
The map shows AD 117 as the largest date, after Trajan's eastern conquests. By AD 211 the empire was a little smaller, at about 4,812,484 km².
How many modern countries were part of the Roman Empire?
45 modern countries were at least partly inside the empire at one of the 13 key dates on this map. At AD 117, 45 of them were. The tool lists them for any date, with the share of each country that was inside.
When did the Roman Empire fall?
It fell twice, in a sense. The Western empire ended in AD 476, when the last western emperor was deposed. The Eastern empire carried on until Constantinople fell in AD 1453, when it had shrunk to about 22,624 km².
What was the Byzantine Empire?
The Byzantine Empire is the modern name for the Eastern Roman Empire, which carried on after the division of AD 395 and the end of the West in AD 476. Its people called themselves Romans. On this map it covered about 1,941,191 km² in AD 395 and about 22,624 km² in AD 1453. See the Byzantine Empire map for each date.
Was Britain part of the Roman Empire?
Yes, in part. The province of Britannia was Roman from AD 43 to AD 410, with its capital at Londinium. The United Kingdom is inside the outline at 3 of the key dates, from AD 117 to AD 395, and at most 69% of it was inside, because much of the far north and all of Ireland were never part of the province. The Roman Britain page, linked above the questions, has the details.
How long did the Roman Empire last?
It depends where you start and stop. The map begins with the traditional founding of Rome in 753 BC and ends with the fall of Constantinople in AD 1453. The Western empire ended in AD 476, so the empire's own history is shorter if you stop there, and longer if you count the Eastern empire.
How accurate are the borders on this map?
They are approximate and debated. Frontier zones were not hard lines, client kingdoms are hard to draw, and the early dates are rebuilt from later province outlines. The legend under the map and the data sources page explain how each date was built.
Where do the borders on the Roman Empire map come from?
The empire and province outlines come from the Ancient World Mapping Center at the University of North Carolina at Chapel Hill, published under the Open Database Licence (ODbL). Dates that the Center does not map are built from its province outlines or from modern regions, and each year page says which method it used.
Data credits: see all data sources and licences. Province and empire extents: Ancient World Mapping Center (UNC-Chapel Hill), ODbL 1.0.